Taking part in a proficiency testing program enables laboratories to control the accuracy of their analytical results. BIPEA provides accuracy monitoring charts that visually represent the accuracy of results for a given criterion over a certain period of time.
At each round, an accuracy monitoring chart is delivered for each analytical criterion, allowing laboratories to track their accuracy results over time.
…
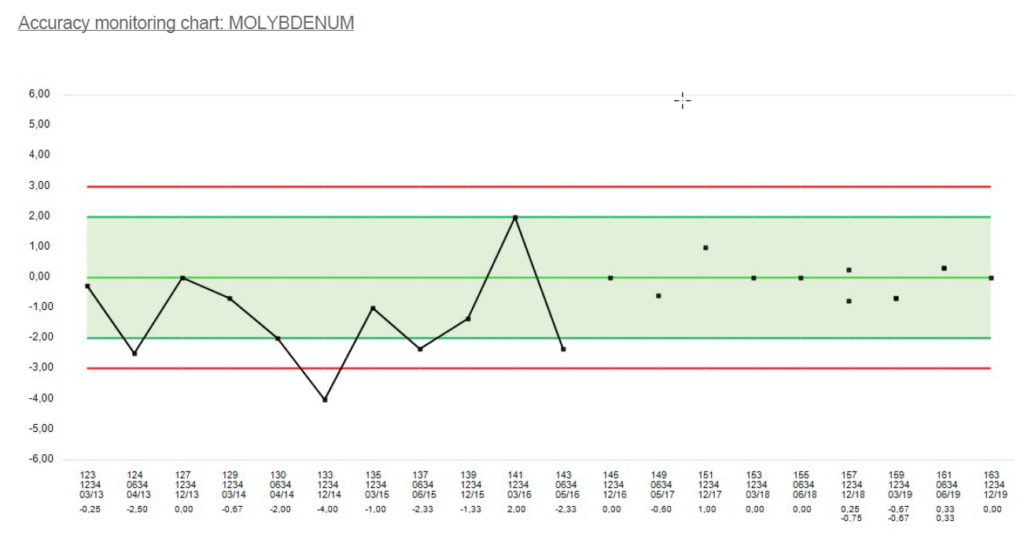
Exemple : MOLYBDENUM IN WATER parameter
…
…
Advantages:
A monitoring and decision-making tool that can quickly highlight deviations, which may not correspond to a lack of accuracy due to:
• Slow and continuous drifts (ascending or descending),
• Systematic bias,
• Matrix effect.
…
For an evaluator during an audit, your accuracy monitoring chart helps to quickly visualize the results of a proficiency test (PT) for a specific criterion and assess the efficiency of corrective actions.